There are occasions where additional primary research is required for a project. While professional researchers must comply with a formal review process for approving research that involves human subjects, a student who wants to add some survey results to a class paper shouldn't have any problems. These instructions are for individuals with access to Microsoft Office 365 and the Office app Forms.
Purpose: Create a survey using the Microsoft Office 365 Forms app.
There are two ways to start.
The first is to access Forms from the MYSCSU screen.
The second way to access Forms is from the dropdown app menu available on the top left corner of the browser screen, in most Office 365 apps.
On the forms page, there are very few options.
- Make sure the My forms tab is selected.
- Select New Form.
Do not select New Quiz because that will not allow you to create a survey.
The new form has a place for a title and a button for adding new questions.
- Click on the title field to customize the title.
- Enter a description is an optional field.
- Click Add new to add the first question to the survey.
Any of the four kinds of survey questions are good options for a class survey.
- Choice lets you create multiple answers from which a survey subject can choose.
- Text lets you create an open field in which a survey subject can write their own answer.
- Rating is a way for you to propose a situation, product, or opinion that you want survey subjects to evaluate.
- Date is for questions to which the answer is a preferred date. This survey might even be a way to collaborate on schedules when planning meetings.
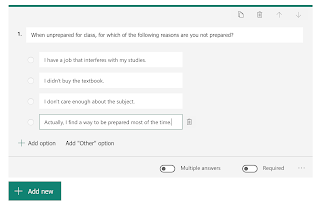
For the purposes of these instructions, I selected the Choice option.
- Enter the question in the question field.
- Each question automatically comes with two default answer fields: Option 1 and Option 2.
- Write your own words to replace the text "Option 1" or "Option 2."
- Click Add option to add over three options. In the picture, I created four optional answers.
Forms will always automatically save the form. You can identify the status of the saved form. Below the top menu bar, in the top right of the screen is a status update. The status of my example reads "Saved."
Optionally, you can click on the Theme tab to select from among preset themes.
To complete your survey, you need to distribute the survey to friends or student peers.
- Click on the Share tab.
- The Copy option is the default selection.
- Use the Copy button to copy the URL address of the survey.
- There are other options for distribution.
- Past the URL into the method you are using for distribution (i.e. Blackboard discussion post, etc.).
After friends and peers have answered the questions, Forms gives a real-time analysis of the answers.
- Open the survey.
- Click ont he Responses tab.
- Review the pie charts that represent the analysis of the answers.
- These instructions can help you post a link to Blackboard.
Note: My example only has one subject so there is only one result. However, the pie chart will become more dynamic when more subjects respond to the survey.
There are two ways to start.
The first is to access Forms from the MYSCSU screen. | |
The second way to access Forms is from the dropdown app menu available on the top left corner of the browser screen, in most Office 365 apps.
| |
On the forms page, there are very few options.
Do not select New Quiz because that will not allow you to create a survey.
| |
The new form has a place for a title and a button for adding new questions.
| |
Any of the four kinds of survey questions are good options for a class survey.
| |
For the purposes of these instructions, I selected the Choice option.
| |
Forms will always automatically save the form. You can identify the status of the saved form. Below the top menu bar, in the top right of the screen is a status update. The status of my example reads "Saved."
| |
Optionally, you can click on the Theme tab to select from among preset themes.
| |
To complete your survey, you need to distribute the survey to friends or student peers.
| |
After friends and peers have answered the questions, Forms gives a real-time analysis of the answers.
Note: My example only has one subject so there is only one result. However, the pie chart will become more dynamic when more subjects respond to the survey.
|
All instructions and documentation written by:
Dr. Jason Lawrence, M.S., Ph.D.
Theory and Practice of Professional Communication
Artificial Intelligence writers, Internal Documentation, and Emergent Texts
Visit my Official Blog, my LinkedIn profile, or my Web Page.
Visit my Official Blog, my LinkedIn profile, or my Web Page.


